 Fairange
Data report · Nov 3, 2026
Plumber hourly cost by metro
OEWS plumber (47-2152) mainland hourly means from $21.72/hr (Hot Springs, AR) to $54.94/hr (San Jose-Sunnyvale-Santa Clara, CA); spread ~$33.22/hr.
Last updated from data: BLS OEWS May 2025 · PPI construction materials 2026-09
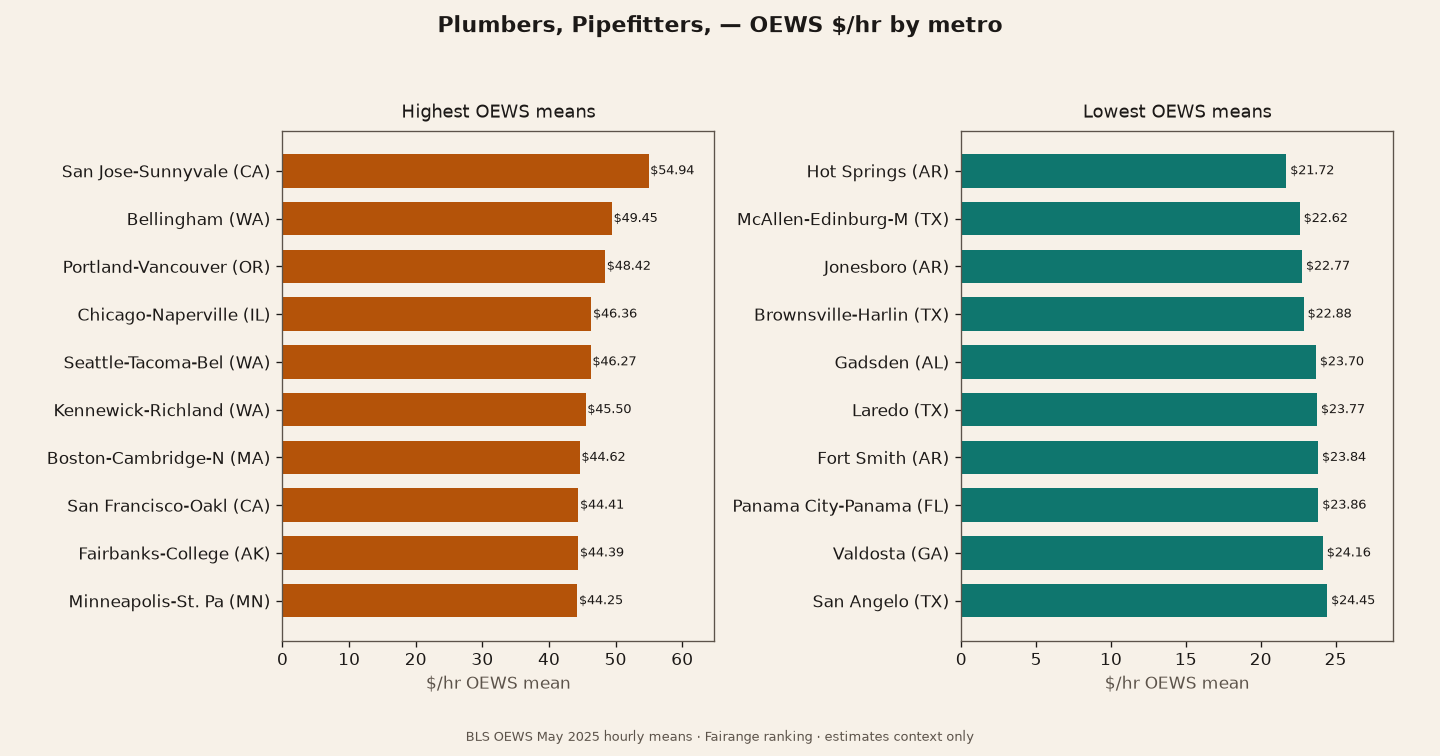
When a homeowner asks what a plumber costs around here, the honest public answer starts with wages — not a marketplace “average job.” This ranking lists every U.S. metro with a published BLS OEWS May 2025 mean for Plumbers, Pipefitters, and Steamfitters (SOC 47-2152), sorted by that hourly mean.
Among mainland metros, means run from about $21.72/hr in Hot Springs, AR to $54.94/hr in San Jose-Sunnyvale-Santa Clara, CA (spread ~$33.22/hr). Medians and p10–p90 bands sit beside the mean so you can see how wide the published distribution is.
These are employer-reported wage means, not what you will be billed after trip fees, after-hours rates, or materials. Fairange job estimates multiply local means by our published hours and markup — open the calculator with your ZIP for that translation.
State notes: among the twelve priciest mainland metros for plumber wages, state counts lean WA (3), CA (2), OR (1), IL (1). On the inexpensive end: AR (4), TX (4), FL (2), AL (1). State lines are geography context — OEWS publishes metro means, not a statewide official rate for this ranking.
Highest plumber wage metros (mainland)
| # | Metro | St | Mean $/hr | Median | p10–p90 |
|---|---|---|---|---|---|
| 1 | San Jose-Sunnyvale-Santa Clara | CA | $54.94 | $51.71 | $30.42–$74.81 |
| 2 | Bellingham | WA | $49.45 | $49.40 | $23.86–$69.49 |
| 3 | Portland-Vancouver-Hillsboro | OR | $48.42 | $48.56 | $27.71–$70.72 |
| 4 | Chicago-Naperville-Elgin | IL | $46.36 | $49.70 | $25.94–$61.15 |
| 5 | Seattle-Tacoma-Bellevue | WA | $46.27 | $45.78 | $24.97–$73.80 |
| 6 | Kennewick-Richland | WA | $45.50 | $46.70 | $22.94–$70.13 |
| 7 | Boston-Cambridge-Newton | MA | $44.62 | $46.52 | $25.13–$69.21 |
| 8 | San Francisco-Oakland-Fremont | CA | $44.41 | $37.44 | $23.34–$74.68 |
| 9 | Fairbanks-College | AK | $44.39 | $46.48 | $29.61–$58.24 |
| 10 | Minneapolis-St. Paul-Bloomington | MN | $44.25 | $48.86 | $24.70–$58.52 |
| 11 | New York-Newark-Jersey City | NY | $43.66 | $37.79 | $23.02–$69.94 |
| 12 | Vineland | NJ | $43.49 | $37.05 | $22.82–$63.97 |
Lowest plumber wage metros (mainland)
| # | Metro | St | Mean $/hr | Median | p10–p90 |
|---|---|---|---|---|---|
| 1 | Hot Springs | AR | $21.72 | $22.51 | $14.63–$30.53 |
| 2 | McAllen-Edinburg-Mission | TX | $22.62 | $22.17 | $14.60–$29.87 |
| 3 | Jonesboro | AR | $22.77 | $22.61 | $15.31–$30.06 |
| 4 | Brownsville-Harlingen | TX | $22.88 | $22.53 | $15.71–$30.68 |
| 5 | Gadsden | AL | $23.70 | $22.76 | $13.48–$31.86 |
| 6 | Laredo | TX | $23.77 | $22.28 | $15.67–$33.53 |
| 7 | Fort Smith | AR | $23.84 | $23.24 | $17.66–$30.06 |
| 8 | Panama City-Panama City Beach | FL | $23.86 | $22.98 | $15.39–$33.51 |
| 9 | Valdosta | GA | $24.16 | $22.15 | $17.99–$29.83 |
| 10 | San Angelo | TX | $24.45 | $23.10 | $17.16–$32.93 |
| 11 | Little Rock-North Little Rock-Conway | AR | $24.60 | $23.65 | $16.88–$32.95 |
| 12 | Gainesville | FL | $24.62 | $24.81 | $15.26–$32.31 |
Related: plumber job costs by city · toilet install by metro · repair labor composite · methodology.
Also: ZIP calculator · trades · city guides · how we estimate · press & data · embeds · all reports
By The Fairange team · [email protected]