Fairange · free to embed with attribution
Repair labor cost index by metro
Composite of published BLS OEWS May 2025 hourly means (HVAC, plumber, roofer, electrician). Not a contractor bid.
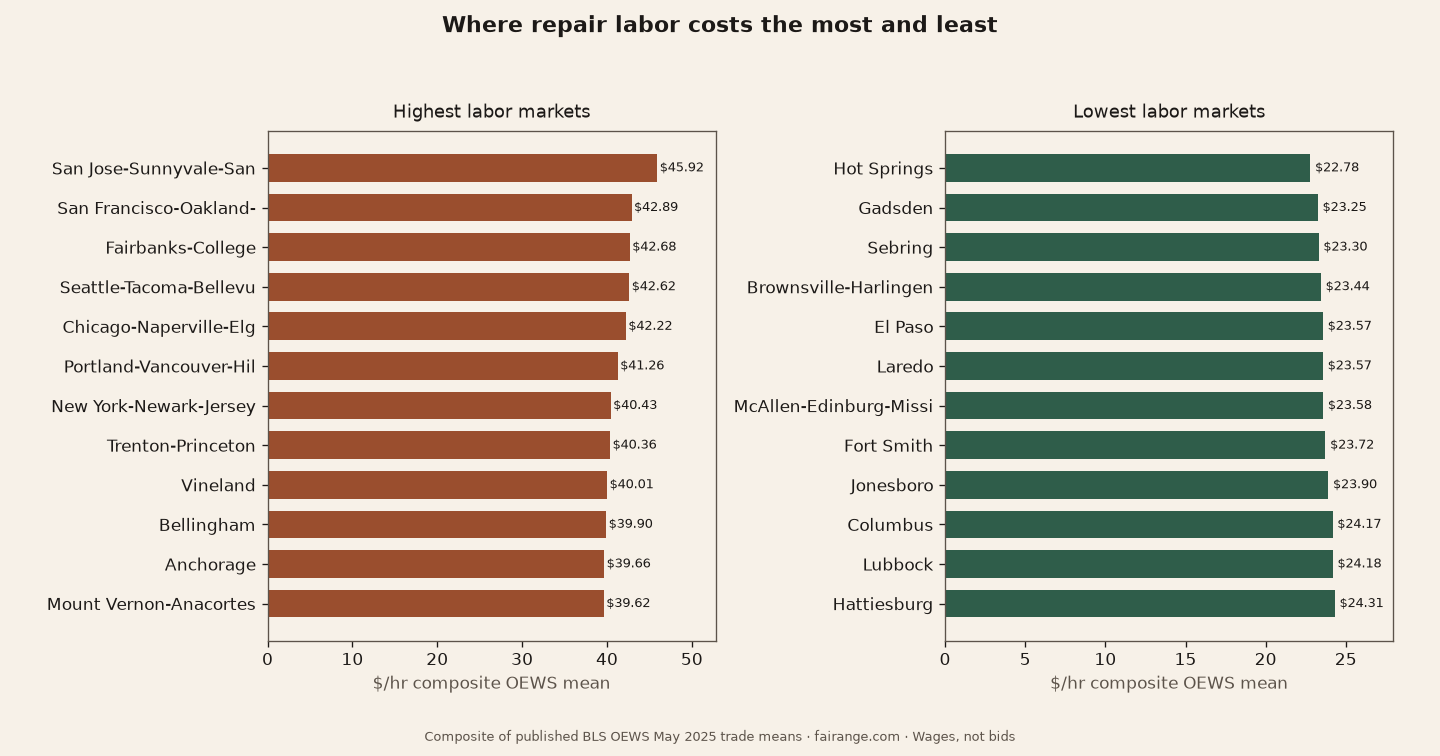
Highest (mainland)
| # | Metro | St | $/hr |
|---|---|---|---|
| 1 | San Jose-Sunnyvale-Santa Clara | CA | $45.92 |
| 2 | San Francisco-Oakland-Fremont | CA | $42.89 |
| 3 | Fairbanks-College | AK | $42.68 |
| 4 | Seattle-Tacoma-Bellevue | WA | $42.62 |
| 5 | Chicago-Naperville-Elgin | IL | $42.22 |
| 6 | Portland-Vancouver-Hillsboro | OR | $41.26 |
| 7 | New York-Newark-Jersey City | NY | $40.43 |
| 8 | Trenton-Princeton | NJ | $40.36 |
| 9 | Vineland | NJ | $40.01 |
| 10 | Bellingham | WA | $39.90 |
Lowest (mainland)
| # | Metro | St | $/hr |
|---|---|---|---|
| 1 | Hot Springs | AR | $22.78 |
| 2 | Gadsden | AL | $23.25 |
| 3 | Sebring | FL | $23.30 |
| 4 | Brownsville-Harlingen | TX | $23.44 |
| 5 | El Paso | TX | $23.57 |
| 6 | Laredo | TX | $23.57 |
| 7 | McAllen-Edinburg-Mission | TX | $23.58 |
| 8 | Fort Smith | AR | $23.72 |
| 9 | Jonesboro | AR | $23.90 |
| 10 | Columbus | GA | $24.17 |
Cite this
Full methodology: repair labor report · how we estimate