 Fairange
Data report · Nov 3, 2026
Appliance repair vs replace — by metro
Fridge repair mid is about 14% of replace nationally; mainland replace mids span roughly $442.
Last updated from data: BLS OEWS May 2025 · PPI construction materials 2026-09
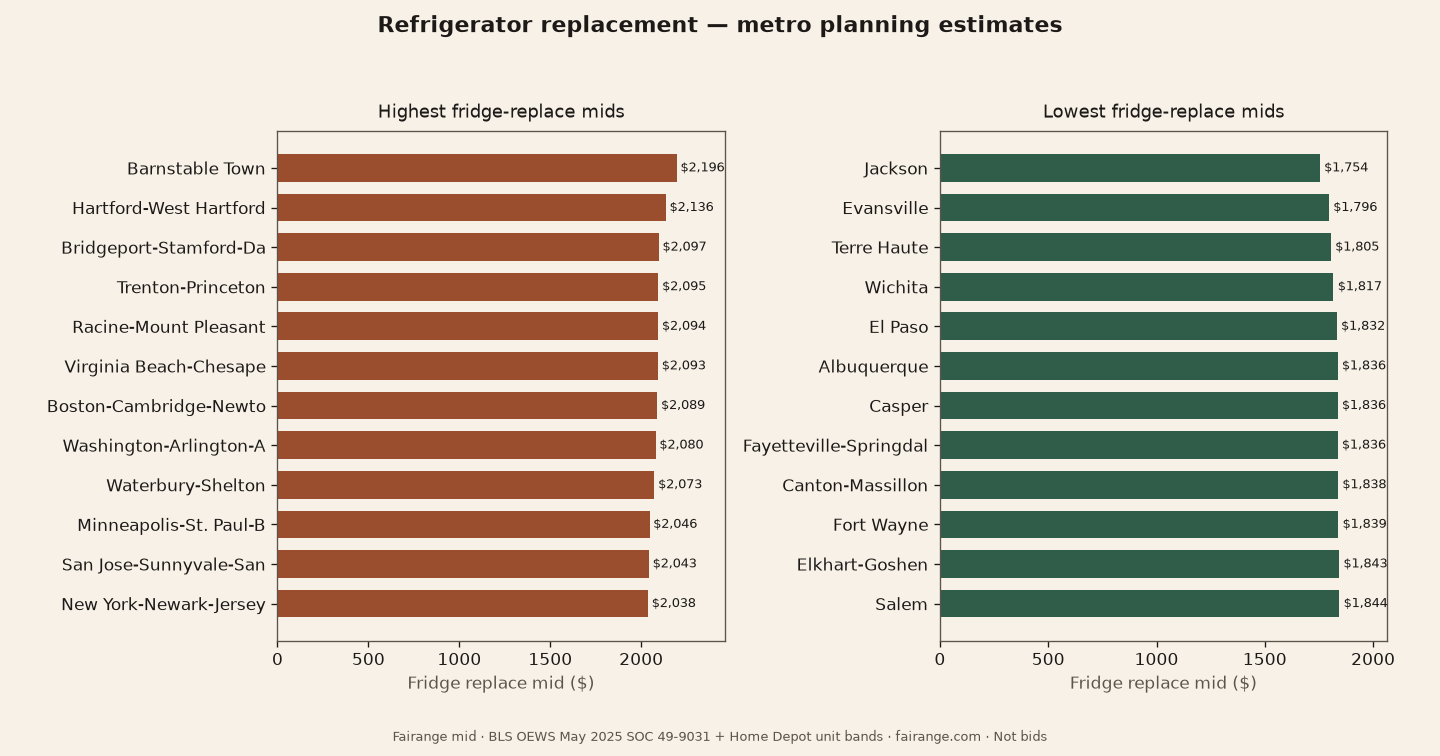
The old rule of thumb says: if a repair quote tops about half the price of a new unit, replace it. We can put numbers on that without inventing retail prices. For every metro that publishes a local OEWS wage for Home Appliance Repairers (SOC 49-9031), we compared our mid planning estimates for fridge repair versus the new fridge replacement job — same wage file, Home Depot unit bands cited in DATA_SOURCES, same markup schedule.
Nationally, a typical fridge repair mid lands around $281 against a replace mid of about $1,942 — roughly 14% of the replace mid. That’s well under the 50% rule for a routine visit; sealed-system compressor work is a different animal and often tips the math.
Because a new fridge is mostly the appliance, geography barely budges the replace mid: mainland metros only span about $442 from Jackson ($1,754) to Barnstable Town ($2,196). Labor markets show up more clearly in the repair line — and in how large that repair is as a share of replace.
Priciest metros to replace a fridge
| # | Metro | St | Replace mid | Repair mid | Repair share | Wage |
|---|---|---|---|---|---|---|
| 1 | Barnstable Town | MA | $2,196 | $355 repair | 16% of replace | $40.66/hr |
| 2 | Hartford-West Hartford-East Hartford | CT | $2,136 | $338 repair | 16% of replace | $37.44/hr |
| 3 | Bridgeport-Stamford-Danbury | CT | $2,097 | $326 repair | 16% of replace | $35.31/hr |
| 4 | Trenton-Princeton | NJ | $2,095 | $326 repair | 16% of replace | $35.19/hr |
| 5 | Racine-Mount Pleasant | WI | $2,094 | $325 repair | 16% of replace | $35.13/hr |
| 6 | Virginia Beach-Chesapeake-Norfolk | VA | $2,093 | $325 repair | 16% of replace | $35.10/hr |
| 7 | Boston-Cambridge-Newton | MA | $2,089 | $324 repair | 16% of replace | $34.88/hr |
| 8 | Washington-Arlington-Alexandria | DC | $2,080 | $321 repair | 15% of replace | $34.38/hr |
| 9 | Waterbury-Shelton | CT | $2,073 | $319 repair | 15% of replace | $34.03/hr |
| 10 | Minneapolis-St. Paul-Bloomington | MN | $2,046 | $312 repair | 15% of replace | $32.57/hr |
| 11 | San Jose-Sunnyvale-Santa Clara | CA | $2,043 | $311 repair | 15% of replace | $32.41/hr |
| 12 | New York-Newark-Jersey City | NY | $2,038 | $309 repair | 15% of replace | $32.10/hr |
Least expensive metros to replace a fridge
| # | Metro | St | Replace mid | Repair mid | Repair share | Wage |
|---|---|---|---|---|---|---|
| 1 | Jackson | MS | $1,754 | $226 repair | 13% of replace | $16.76/hr |
| 2 | Evansville | IN | $1,796 | $239 repair | 13% of replace | $19.02/hr |
| 3 | Terre Haute | IN | $1,805 | $241 repair | 13% of replace | $19.51/hr |
| 4 | Wichita | KS | $1,817 | $244 repair | 13% of replace | $20.12/hr |
| 5 | El Paso | TX | $1,832 | $249 repair | 14% of replace | $20.95/hr |
| 6 | Albuquerque | NM | $1,836 | $250 repair | 14% of replace | $21.20/hr |
| 7 | Casper | WY | $1,836 | $250 repair | 14% of replace | $21.18/hr |
| 8 | Fayetteville-Springdale-Rogers | AR | $1,836 | $250 repair | 14% of replace | $21.18/hr |
| 9 | Canton-Massillon | OH | $1,838 | $251 repair | 14% of replace | $21.30/hr |
| 10 | Fort Wayne | IN | $1,839 | $251 repair | 14% of replace | $21.36/hr |
| 11 | Elkhart-Goshen | IN | $1,843 | $252 repair | 14% of replace | $21.54/hr |
| 12 | Salem | OR | $1,844 | $252 repair | 14% of replace | $21.60/hr |
Where repair is a larger share of replace
High-wage metros push diagnostic labor up faster than the sticker on a new French-door unit. These mainland metros show the highest fridge-repair mid as a share of fridge-replace mid — useful when you’re weighing a second service call against hauling in a new box.
| # | Metro | St | Repair | Replace | Share | Wage |
|---|---|---|---|---|---|---|
| 1 | Barnstable Town | MA | $355 | $2,196 | 16% | $40.66/hr |
| 2 | Hartford-West Hartford-East Hartford | CT | $338 | $2,136 | 16% | $37.44/hr |
| 3 | Trenton-Princeton | NJ | $326 | $2,095 | 16% | $35.19/hr |
| 4 | Virginia Beach-Chesapeake-Norfolk | VA | $325 | $2,093 | 16% | $35.10/hr |
| 5 | Racine-Mount Pleasant | WI | $325 | $2,094 | 16% | $35.13/hr |
| 6 | Bridgeport-Stamford-Danbury | CT | $326 | $2,097 | 16% | $35.31/hr |
| 7 | Boston-Cambridge-Newton | MA | $324 | $2,089 | 16% | $34.88/hr |
| 8 | Waterbury-Shelton | CT | $319 | $2,073 | 15% | $34.03/hr |
| 9 | Washington-Arlington-Alexandria | DC | $321 | $2,080 | 15% | $34.38/hr |
| 10 | San Jose-Sunnyvale-Santa Clara | CA | $311 | $2,043 | 15% | $32.41/hr |
We also published washer and dryer replacement jobs with the same sourcing rules — compare washer repair vs washer replace, or dryer repair vs replace, with your ZIP. Parts-only repair bands and unit prices are listed on each job. More appliance wage context: appliance repair labor by metro.
Also: ZIP calculator · city guides · how we estimate · press kit
By The Fairange team · [email protected]